
Unleash your productivity with automated slide creation
Use-case:
You have tabular data in any format, google sheets, excel files, or from data bases, and you want to generate a set of standard and pre-customized slide presentations based on these data. Ideally this data contains a combination of text description, text categorical or itemized, and picture, so the slide looks more presentable. Let’s see what I have created here as an example below,
Video Tutorial for this blog is available here:
Step1: Initial data for slides content
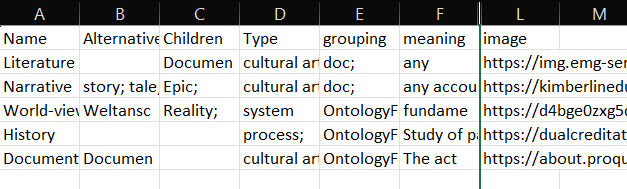
Step2: data input
I already created a custom template for the slide presentation I want to have. It is in html format.
- You can find more information on how this template is created in this corresponding tutorial:
Next step is specifying how each column from data need to be represented and fill this pre-planned slide template.
In below, what I am doing is going through line by line of data and connect data column to objects in html template. In this example, these columns or objects are meaning, Other meanings, image, Alternative or related, etc.
allslides = ''
for i in range(0, df.shape[0]):
    meaning = ''
    if (pd.isnull(df.at[i, 'meaning']) is False):
        xl = df.at[i, 'meaning'].replace('\n', '').replace('; ', ';').replace(';;', ';').split(";")
        for x in xl:
            if (x != ''):
                meaning = meaning + '<li>'+x.capitalize()+'</li>\n'

    if (pd.isnull(df.at[i, 'Other meanings']) is False):
        xl = df.at[i, 'Other meanings'].replace('\n', '').replace('; ', ';').replace(';;', ';').split(";")
        for x in xl:
            if (x != ''):
                meaning = meaning + '<li>'+x.capitalize()+'</li>\n'

    image = str(df.at[i, 'image']).split(";")[0]


    slide = """ <section class="slide">

                <h2>"""+df.at[i, 'Name']+"""</h2>

            <section class="cust">
                <nav>

                <b>Alternative or related:</b>"""+str(df.at[i, 'Alternative']).replace('nan', '')+"""
                    </br>
                </br>

                <b>Type:</b>"""+str(df.at[i, 'Type']).replace('nan', '')+"""
                    </br>
                </br>

                <b>Linguistic:</b> """+str(df.at[i, 'Linguistic root']).replace('nan', '')+""";
                    </br>
                </br>

                <b>Figures:"""+str(df.at[i, 'Pioneers']).replace('nan', '')+"""</b>
                </nav>

                <article>
                    <img src="""+str(image).replace('nan', '')+"""
                    style="object-fit:cover;width:350px;
                    height:250px;  top:70px;
                    border: solid 1px #CCC">
                    <span><ul>"""+meaning+"""

                    </ul></span>
                </article>
            </section>

        </section>
    """
    allslides = allslides + slide
Step3: updating the html file
x = html[:html.find('<!--the start-->')+18] +\
    allslides +\
    html[html.find('<!--the end-->')-1:]


# %%
f = open('./shower/themes/ribbon/index2.html', "w")
f.write(x)
f.close()
Finds us on Youtube: youtube.com/@winswithdata
Related Links
- code solution script: https://github.com/winswithdata/automated-slides
Check out these related tutorial in your convenient time:
- For python related tutorials, see this playlist of video tutorials: https://www.youtube.com/playlist?list=PL_b86y-oyLzAQOf0W7MbCXYxEkv27gPN6
- For statistical and econometric related tutorials, see this playlist of video tutorials: https://www.youtube.com/watch?v=aHBquefG6dQ&list=PL_b86y-oyLzDTtPT8Y1zTt4kLpdOBhxOZ
- For web-scraping tutorials, see this playlist of video tutorials: https://www.youtube.com/watch?v=RLnPN4HE-Qs&list=PL_b86y-oyLzDp2EBX-k2bjIBW9SgH3sxT